Body Composition Analysis of Obesity and Hepatic Steatosis in Mice by Relaxation Compensated Fat Fraction (RCFF) MRI
David H. Johnson, Sreenath Narayan, David L. Wilson, and Chris A. Flask
This is an author's electronic pre-print of the following publication. JMRI allows pre-prints to be shared through individual author's websites; for terms, please see this website's license. Please cite the published work as:
Body Composition Analysis of Obesity and Hepatic Steatosis in Mice by Relaxation Compensated Fat Fraction (RCFF) MRI. Free HTML format! Johnson DH, Narayan S, Wilson DL, Flask CA. J Magn Reson Imaging 2012;35(4):837-843. Pubmed: 22095745. Journal's version: 10.1002/jmri.23508.
Address for correspondence: David L. Wilson, Ph.D. dlw@case.edu.
ABSTRACT
Purpose: To develop and validate a quantitative MRI methodology for phenotyping animal models of obesity and fatty liver disease on 7T small animal MRI scanners.
Materials and Methods: A new MRI acquisition and image analysis technique, Relaxation-Compensated Fat Fraction (RCFF), was developed validated by both Magnetic Resonance Spectroscopy and histology. This new RCFF technique was then used to assess lipid biodistribution in two groups of mice on either a high fat (HFD) or low fat (LFD) diet.
Results: RCFF demonstrated excellent correlation in phantom studies (R2=0.99) and in vivo in comparison to histological evaluation of hepatic triglycerides (R2=0.90). RCFF images provided robust fat fraction maps with consistent adipose tissue values (82%±3%). HFD mice exhibited significant increases in peritoneal and subcutaneous adipose tissue volumes in comparison to LFD controls (peritoneal: 6.4±0.4 cm3 vs. 0.7±0.2, P<0.001; subcutaneous: 14.7±2.0 cm3 vs. 1.2±0.3 cm3, P<0.001). Hepatic fat fractions were also significantly different between HFD and LFD mice (3.1%±1.7% LFD vs. 27.2%±5.4% HFD, P = 0.002).
Conclusion: RCFF can be used to quantitatively assess adipose tissue volumes and hepatic fat fractions in rodent models at 7T.
INTRODUCTION
Nonalcoholic fatty liver disease (NAFLD) is emerging as a major world-wide health problem affecting approximately one third of all adults (1). NAFLD is characterized by initial hepatic lipid accumulation and can progress to Nonalcoholic Steato-Hepatitis (NASH) consisting of hepatic inflammation and fibrosis (2, 3). Eventually, late stage disease can progress to cirrhosis and eventually Hepatocellular Carcinoma (HCC) (2, 4-7). A multitude of genetic and dietary models of obesity / NAFLD have been developed in response to clinical interest in obesity and NAFLD with the eventual goal of establishing new therapies and interventional strategies to limit NAFLD progression (8-10). Although the association between obesity and NAFLD is generally accepted, the linkages between specific lipid stores such as subcutaneous and peritoneal adipose tissues have not been fully characterized in relation to fatty liver (11).
One important advance needed to enable a better understanding of NAFLD progression is a non-invasive methodology to longitudinally quantify lipid compartments in animal models of obesity / NAFLD. Of the many medical imaging modalities, MRI provides all of the requirements for quantitative analysis of lipids including high spatial resolution, 3D imaging capability, and excellent soft tissue contrast. Most importantly for longitudinal studies, MRI provides these capabilities without the use of ionizing radiation (as in CT), which can directly impact physiologic processes, especially for high resolution preclinical CT scanners. Even though many MRI lipid acquisition techniques have been presented (12-16), preclinical MRI research studies are severely limited by the long and tedious effort needed to analyze the entire image set (ex. 15-25 2D images) which can require 1-3 (17) days to generate results for a single animal. Therefore, an imaging experiment with 8-12 total animals would require weeks for complete analysis. This labor intensive and normally subjective process compounds when multiple timepoints are required for each animal.
In this report, we have fully developed and validated a comprehensive MRI acquisition and analysis technique to simultaneously assess peritoneal and subcutaneous adipose tissue volumes as well as hepatic fat fractions for use in rodent models of NAFLD on a preclinical 7T MRI scanner, which we term the Relaxation Compensated Fat Fraction (RCFF) method. We first describe our MRI acquisition techniques followed by our semiautomatic image analysis techniques which compensate for both T1 and T2 magnetic relaxation and MRI coil inhomogeneities. Finally, we demonstrate and validate these techniques in lipid phantoms and in an established mouse model of obesity and Non-Alcoholic Fatty Liver Disease (NAFLD) in comparison to lean controls. Overall, this new, optimized methodology allows for robust quantification in animals models with a total MRI acquisition time of approximately 15 minutes and a processing time of only 1 hour for each animal to obtain multiple quantitative assessments of lipid biodistribution.
METHODS
MRI Acquisition Design
A 2D T1-weighted asymmetric echo, Rapid Acquisition with Relaxation Enhancement (aRARE) sequence was developed on a Bruker Biospec 7T small animal MRI scanner (Bruker Biospin, Billerica, MA) (TR=1087 ms, TE=9.1 ms, FOV = 100 x 50 mm, 512x256 matrix, 4 averages, echo train length = 4, slice thickness = 1 mm). The aRARE sequence provided a user-selectable echo delay to achieve π/6, 5p/6, and 3p/2 radian shifts between fat and water (echo shifts of 79, 396, and 714 μs at 7T). The MRI images obtained from the aRARE acquisition described above were used to generate separate fat and water images by an modified IDEAL image reconstruction technique for 7T described previously (18, 19).
Calculation of Relaxation Compensated Fat Fraction (RCFF) Maps and Segmentation
Imaging data were exported to Matlab (The Mathworks, Natick, MA) for complete analysis. Fat and water images for each imaging slice were first reconstructed and analyzed to generate Relaxation Compensated Fat Fraction (RCFF) maps of each animal as per Eq. 1 and described previously (20).
(1)
where ρf , ρw are the proton densities for both fat and water for each image voxel, T1F, T2F, T1W, T2W are the T1 and T2 magnetic relaxation time constants for fat and water, and TR and TE are the aRARE acquisition repetition and echo times (20). Magnetic relaxation times for both fat and water were determined both empirically (Tables 1-3) and from prior published reports.
Table 1. Measured T1 and T2 values in oil and water phantoms. RAREVTR for T1, MSME for T2
|
|
T1 (ms) |
T2 (ms) |
|
Soybean Oil |
500 |
32 |
|
Water |
2900 |
360 |
Table 2. Measured T1 and T2 values in a low fat diet mouse
|
|
T1 (ms) |
T2 (ms) |
|
Muscle |
2600 ± 539 |
20.2 ± 3.6 |
|
Visceral adipose tissue |
848 ± 82.5 |
60.5 ± 6.3 |
|
Liver |
2140 ± 682.5 |
43.9 ± 9.1 |
Table 3. Measured T1 and T2 values in a high fat diet mouse.
|
|
T1 (ms) |
T2 (ms) |
|
Muscle |
2200 ± 345 |
25.1 ± 3.3 |
|
Visceral adipose tissue |
847 ± 41.5 |
76.5 ± 6.1 |
|
Liver |
1943 ± 170.5 |
39.4 ± 3.2 |
The quantitative RCFF images were first automatically segmented into adipose tissue and non-adipose tissue compartments by simple thresholding (adipose tissue > 0.85 RCFF; non-adipose tissue < 0.85 RCFF) as previously reported (20). Thresholding was also used to remove the background signal from each image. The adipose tissue compartment was further segmented into subcutaneous and visceral adipose tissues with manual tracing of the peritoneal wall in each RCFF image. Total adipose tissue volumes (subcutaneous and visceral) were obtained by summing the individual image volumes across all imaging slices.
In Vitro Validation
Phantom studies were conducted to validate the RCFF methodology. Intralipid (20% soybean oil emulsion by weight, Sigma Aldrich) was diluted with deionized water (Millipore MilliQ deionizing water system) to create 50 ml conical tubes of 20%, 15%, 10%, and 5% soybean oil by weight. Two additional tubes of unmixed, pure soybean oil and deionized water were also imaged (herein referred to as 100% and 0% soybean oil by weight). The T1 and T2 were empirically determined to be 2900 ms and 360 ms for water, and 500 ms and 32 ms for oil. The spectrum of soybean oil is well-known (21, 22); our sample contained peaks at 0.9 ppm (relative integral 0.2), 1.3 ppm (1.0), 1.6 ppm (0.10), 2.0 ppm (0.18), 2.3 ppm (0.14), 2.7 ppm (0.08), and 5.3 ppm (0.2). Additional images were acquired with a very long TR (15 seconds) as a reference for comparison with the post-processing T1 correction. MR spectra were acquired (TR=1087 ms, TE=9.1 ms, 8 x 8 x 8 mm3 voxel, 30 averages) in each tube individually using PRESS as further validation of the imaging RCFF measurements. MRS data were also corrected for T1 and T2 relaxation with the empirically-derived values for fat and water above.
In Vivo Validation: Mouse Models of Dietary Obesity
To test and validate the RCFF method for in vivo applications, images were acquired for groups of high fat diet (HFD) mice and low fat diet (LFD) mice (N=6, 29 week old C57BL/6J male mice from the Jackson Laboratory Diet-Induced Obesity Service, D12492i 60 kcal% fat chow vs. D12450Bi, 10 kcal% fat chow, Research Diets, Inc.). The HFD animals typically exhibit increased peritoneal and subcutaneous adipose tissue as well as increased hepatic steatosis in comparison to LFD and animal fed normal chow (8). To enable accurate RCFF maps, T1 relaxation maps were measured in one 29 week old HFD mouse and one 29 week old LFD mouse using a spin echo scan repeated with 8 different TRs (TE=12.6 ms, TR=690, 811, 955, 1128, 1351, 1661, 2174, and 4000 ms, identical geometry to in vivo aRARE scans) to measure T1W and T1F in muscle, liver, and adipose tissue. T2W and T2F were also measured in the mice using a multiecho spin echo scan (16 echoes equally spaced from 9.7 to 155 ms, TR=4000 ms).
Visceral and subcutaneous adipose tissue volumes were obtained with the RCFF semi-automatic segmentation procedure described above. A mean hepatic fat fraction for each animal was determined by manually drawing an ROI in the right caudate lobe of the liver within the RCFF images. Mean adipose tissue volumes and hepatic fat fractions were calculated for the two groups of mice. All mice were weighed and euthanized immediately after imaging, and the right caudate lobe of the liver was dissected and snap-frozen in liquid nitrogen for triglyceride analysis via chemical lipid extraction. The concentration of triglycerides was measured by the optical density at 900 nm and converted into absolute concentration via a set of known concentration glycerol phantoms. The right median lobe was snap-frozen for histological analysis using Hematoxylin and Eosin (H&E) and Oil-Red-O (ORO) stains.
RESULTS
The RCFF technique resulted in robust and quantitative maps of fat fractions in phantoms (Fig. 1). Relaxation compensation resulted in an increased linear correlation in comparison to the uncompensated results (R2 = 0.99 vs 0.93, Fig. 1b). Agreement of the RCFF measurements with MRS assessments was evaluated using a Bland-Altman plot (Fig 2). The T1-sensitive acquisition (TR = 1087 ms) resulted in a 5% to 15% disagreement between the uncorrected ratio and MRS (Fig 2, closed circles). With the T1 and T2 (Tables 2-3) corrections (Fig 2, X's) this disagreement was reduced to 2% or less for low lipid concentrations, but the disagreement was increased for the pure oil phantom to 12%. The effects of T2 correction alone were investigated by repeating the experiment with a long TR (i.e., TR = 15000 ms) to limit T1 effects. The difference between the RCFF and MRS assessments was reduced from ~5% to 2% or less for all low concentrations by incorporating T1/T2 correction.
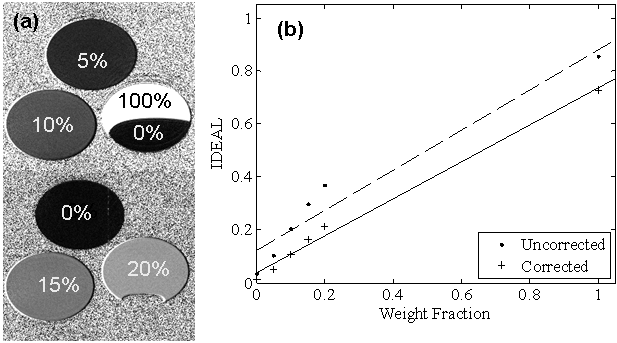
Figure 1. (a) Phantom RCFF images demonstrate visible differences among samples with known lipid concentrations. Note the sensitivity of the contrast between 0% and 20% lipid typical range of hepatic steatosis. (b) Phantom intensity as a function of lipid concentration with (RCFF) and without relaxation compensation.
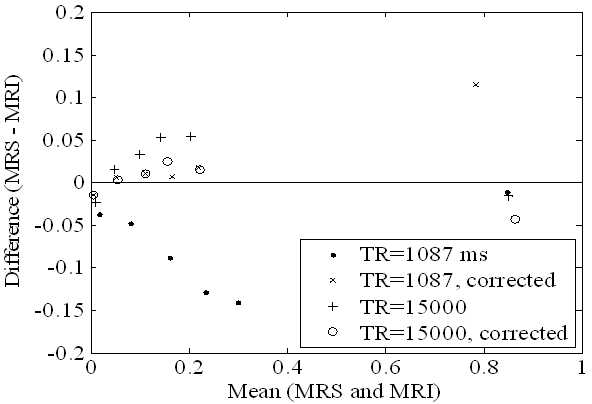
Figure 2. The agreement between the IDEAL MRI and MRS fat fraction measurements in the oil-water phantom are compared by plotting the differences of the measurements against the mean of the measurements (Bland-Altman plot). The T1 and T2 corrections increase the agreement of the IDEAL and MRS measurements for both long (TR=15000ms) and short (TR=1087ms) repetition times.
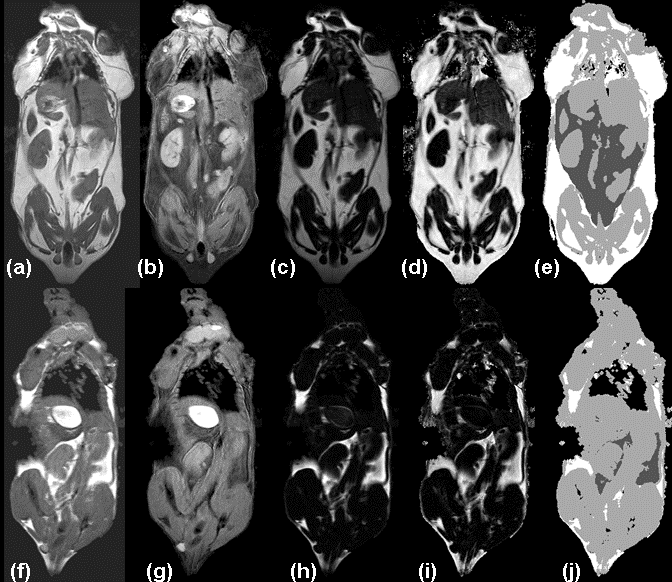
Figure 3. HFD (a-e) and LFD mice (f-j) show in vivo measurement of adipose tissue depots. (a,f) aRARE images are used to reconstruct separate water (b, g) and fat (c, h) images with enhanced tissue contrast (e.g. between kidneys, liver, muscles, and adipose tissue depots). Calculated RCFF images (d, i) enable further semi-automatic tissue volume and intensity quantification (e, j). In the label image, non-visceral adipose tissue is white, visceral adipose is dark gray, muscles and organs are light gray, and air (lungs/background) is black.
As expected, the RCFF analysis demonstrated that the subcutaneous and visceral adipose tissue volumes as well as hepatic fat fractions were significantly increased in HFD mice as compared to LFD mice (Fig 4). At 29 weeks (i.e., 23 weeks on the diets), visceral adipose tissue volumes were increased 9-fold in HFD mice as compared to LFD mice, 6.4±0.4 cm3 vs. 0.7±0.2 cm3, respectively (P<0.001, Fig 4a) while subcutaneous adipose tissue volumes were increased 13-fold, 14.7±2.0 cm3 vs. 1.2±0.3 cm3, respectively (P<0.001, Fig 4b). Hepatic fat fraction was also significantly increased as expected, 19.4%±8.8% vs. 5.0%±1.6% (P<0.001, Fig. 4c). Note the large variation in the liver RCFF values for HFD group of mice.
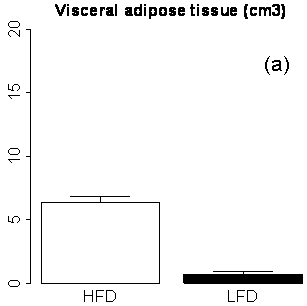
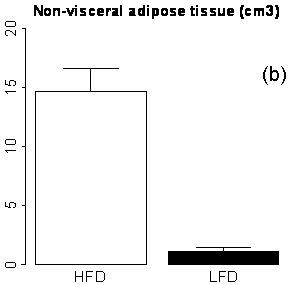
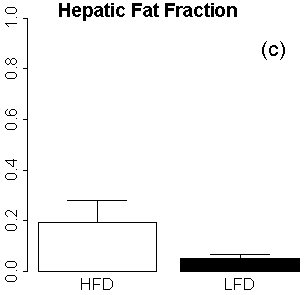
Figure 4. MRI phenotypes as a function of diet and age using RCFF. At 29 weeks of age, the adipose tissue volumes (a, b) and hepatic fat fraction (c) are all significantly different between HFD and LFD mice (P<0.001).
RCFF hepatic fat fraction measurements in the right caudate liver correlated well with the chemical lipid extraction assay (R2 = 0.90, Fig 5a). All of the low fat diet mice exhibited low fat fractions of ~5% (corresponding to 20 mg TG / g liver or less), whereas the high fat diet mice spanned a wide range from 12.5% to 31.0% (corresponding to 60 to 250 mg TG / g liver). High fat diet mice had significantly higher concentrations of liver lipids than the low fat diet mice whether measured by RCFF (P=0.002) or by chemical assay (P<0.001). The RCFF data for the two dietary cohorts were further evaluated by comparing the liver fat fractions with visceral adipose tissue volumes (Fig. 5b). Interestingly, the HFD mice exhibited a relatively constant visceral adipose tissue volume (~6 cm3) even though the hepatic fat fractions varied from 10-30%.
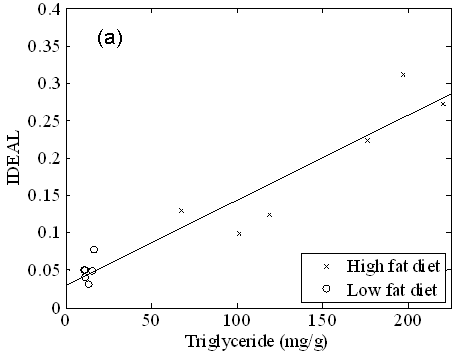
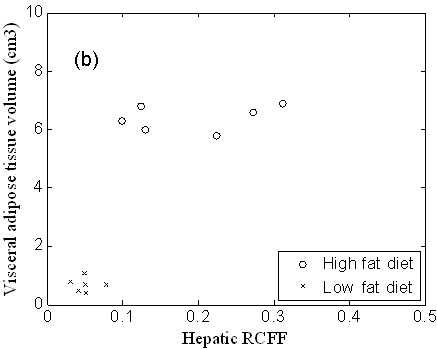
Figure 5. Liver triglycerides, as measured by a chemical assay (a), vary linearly with RCFF (R2=0.90). High fat diet mice had significantly higher concentrations of liver lipids, whether measured by RCFF (P=0.002) or by the chemical assay (P<0.001). A plot of hepatic fat fraction vs. visceral adipose tissue volume (b) distinguished between LFD and HFD mice. In addition, HFD animals appear to reach a maximum visceral adipose tissue volume of 6cm3.
Hepatic RCFF was further validated by H&E and Oil Red O (ORO) staining. Representative histological images of the right caudate liver lobes show significant intracellular lipid accumulations with the 29 week old HFD mouse (Fig 6-a and c) as compared to the 29 week old LFD mouse (Fig 6-b and d). Marked micro and macrovacuolation in hepatocytes was observed extending from the central vein mid-way to the portal triads in the high fat diet mouse (Fig 6-a, H&E). Large fat vacuoles stained in the same location in the ORO stain (Fig 6-c). In contrast, the low fat diet mouse had no significant cytoplasmic vacuolation (i.e. lipid vacuoles) on H&E (Fig 6-b) and no positive staining for cytoplasmic lipid on ORO (Fig 6-d). Histological assessments of the other mice were similar, though ORO staining revealed a range of lipid staining among the high fat diet mice, in qualitative agreement with the RCFF images and chemical lipid extraction assay.
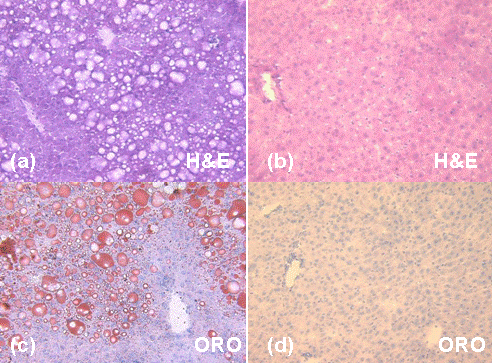
Figure 6. Histology of representative mouse livers shows significant intracellular lipid accumulations in the high fat diet animal (a and c) as compared to the low fat diet animal (b and d). Marked micro and macrovacuolation in hepatocytes extends from the central vein mid-way to the portal triads in the high fat diet mouse (a, H&E stain). In contrast, the low fat diet mouse had no significant cytoplasmic vacuolation (i.e. lipid vacuoles) on H&E (b) and no positive staining for cytoplasmic lipid on ORO (d).
DISCUSSION
We have developed a new quantitative MRI acquisition and image analysis technique: Relaxation-Compensated Fat Fraction (RCFF) MRI to study mouse models of obesity for 7T MRI scanners. RCFF combines multiple asymmetric-echo RARE acquisitions, a previously described modified 7T IDEAL image reconstruction technique, and a semiautomatic image analysis incorporating T1 and T2 relaxation correction. Altogether, the RCFF methodology provides whole body quantitative assessments of subcutaneous and visceral adipose tissue volumes, and hepatic fat fractions mouse models for comparison. The RCFF method can be used to measure adipose tissue volumes throughout the whole animal, and each adipose tissue depot can be individually quantified. These techniques were developed and validated in both phantom and in vivo studies.
In this study, an asymmetric echo RARE acquisition was used to generate the complex image data for reconstruction and analysis. This acquisition provided three distinct fat-water phase shifts necessary for the modified 7T IDEAL reconstruction. At the same time, the aRARE acquisition provided high quality MRI images (in comparison to gradient echo images) with limited respiratory motion artifacts. The multiecho aRARE acquisition also reduced the overall acquisition time in comparison to conventional asymmetric spin echo acquisitions to provide 3 coregistered image sets with an acquisition time of approximately 15 minutes. The modified 7T IDEAL reconstruction used in this study used Brent’s method and planar extrapolation to accurately delineate fat and water components of 20-25 imaging slices in approximately 5 minutes (19, 23). RCFF maps were then calculated from the water and fat magnitude images by Equation 1 above. These maps incorporated T1 and T2 relaxation correction using values obtained from phantom and in vivo assessments.
The RCFF maps were then segmented with our semiautomatic segmentation algorithm. The algorithm automatically segmented adipose tissue, non-adipose tissue (muscle, organs), and background/air with simple thresholding of the RCFF maps. Adipose tissues were found to reliably produce ~80% fat content. All other tissues produced RCFF intensities ≤50%. Air/background was masked out from tissue in the analysis using the mean background noise. The only subjective component of the segmentation algorithm required manual selection of the peritoneal wall in each coronal imaging slice. Fortunately, the peritoneal wall is clearly visible in both the aRARE images as well as the RCFF maps.
Phantom RCFF maps demonstrated a good correlation with known lipid content(Figure 1). These results also demonstrated the importance of T1 and T2 compensation in the calculation of the RCFF maps. Another key finding in the phantom results was that the RCFF technique was able to reliably measure lower lipid concentrations (i.e., 0-20%) which is the typical physiologic range for hepatic steatosis in NAFLD. We should also note that the RCFF technique produced a fat fraction of ~0.8 for the phantom containing 100% lipid. This limitation is expected, since the IDEAL methodology employed in this work used a single peak model for the lipid protons. One potential improvement for the RCFF methodology would be to incorporate a model of the lipid 1H MRS spectrum into the calculation of the total lipid content (24, 25). While incorporating multiple lipid peaks could improve analysis of the spectral properties of fat, it would not likely change the measurement of adipose depot volumes.
The RCFF technique also produced reliable, quantitative in vivo assessments of lipid biodistibution. Regardless of the mouse weight, the RCFF technique was able to reliably produce maps of lipid concentration. This significant result suggests an improvement over conventional fat/water imaging techniques, including standard IDEAL and Dixon, as both tissue susceptibility and B0 inhomogeneities are known to cause errors in fat-water separation on high field small animal scanners. As with the phantom results, the in vivo RCFF maps were significantly improved via the incorporation of T1 and T2 correction. These factors all led to the repeatable intensities of tissues in the RCFF images. For example, adipose tissues were found to exhibit a RCFF of 82 ± 3%. As a result, the RCFF was used to automatically distinguish between adipose and non-adipose tissue. This finding is consistent with findings from other researchers and our previous work in chemical shift imaging (20, 26), where both tissue volumes and intensities after RCFF-correction were highly reproducible.
Use of the RCFF segmentation as well as the manual selection of the peritoneal wall allowed for calculation of the subcutaneous and peritoneal (visceral) adipose tissue volumes in HFD and LFD mice (Figure 4). An ROI analysis of the liver in the RCFF maps also provided an in vivo assessment of hepatic fat fraction (steatosis). The quality of the RCFF technique was also exhibited by the small errors bars on each result for the two groups. Note that the increased variation for the HFD results is mostly due to phenotypic variability rather than variation in the technique. The MRI assessments of adipose tissue volumes were not validated by surgical inspection. The RCFF hepatic fat fractions also compared well with both chemical TG analysis (R2 = 0.90) and histological evaluations (Figure 6). An interesting observation from these results is that the visceral adipose tissue volume reached a plateau at ~6cm3 while hepatic fat fraction (Fig. 5b) and subcutaneous adipose tissue continued to increase.
There are two main limitations of the RCFF technique that have already been described above. First, the use of assumed values of T1 and T2 relaxation values can result in some fat fraction quantification errors. These relaxation errors could result in significant errors in hepatic fat fraction, but would not be expected to affect the quantification of subcutaneous and peritoneal adipose tissue volume as the fat fraction for adipose tissue is much larger than all other tissues. One straightforward method to improve the RCFF methodology would be to simply measure the T1 and T2 relaxation values during each scanning session. However, this approach would require additional scan time and analysis for each animal. A second limitation was the lack of spectral modeling in the RCFF analysis. As mentioned above, the inclusion of spectral modeling would most likely result in increasing the fat fraction of oil phantoms and adipose tissue closer to 1. Despite this limitation, the RCFF technique was able to reliably assess both hepatic fat fractions (in comparison to histopatholigical evaluation) and adipose tissue volumes in both lean and obese mouse models.
In conclusion, this methodology can be used to routinely assess accumulation of lipid depots in mouse models of obesity on high field small animal MRI scanners. The rigorous validation of the RCFF MRI measurements against histology and chemical lipid extraction allows these techniques to be used for longitudinal assessment of progressive obesity in mouse models. As such, the RCFF methodology can now reliably be used to compare the effects of genetics, environment, and therapeutic intervention on the accumulation / depletion of lipid stores. In addition, the RCFF technique provides a useful basis to determine linkages between lipid biodistribution and disease progression for many diseases including diabetes, cardiovascular disease, and fatty liver disease.
REFERENCES
1. P Almeda-Valdés, D Cuevas-Ramos, C A Aguilar-Salinas. Metabolic syndrome and non-alcoholic fatty liver disease. Ann Hepatol 2009; 8 Suppl 1:S18-24.
2. G C Farrell, C Z Larter. Nonalcoholic fatty liver disease: from steatosis to cirrhosis. Hepatology 2006; 43:S99-S112.
3. S K Erickson. Nonalcoholic fatty liver disease. J. Lipid Res. 2009; 50 Suppl:S412-6.
4. R Iannaccone, F Piacentini, T Murakami, et al. Hepatocellular carcinoma in patients with nonalcoholic fatty liver disease: helical ct and mr imaging findings with clinical-pathologic comparison. Radiology 2007; 243:422-430.
5. E Bugianesi, N Leone, E Vanni, et al. Expanding the natural history of nonalcoholic steatohepatitis: from cryptogenic cirrhosis to hepatocellular carcinoma. Gastroenterology 2002; 123:134-140.
6. Y Zen, K Katayanagi, K Tsuneyama, K Harada, I Araki, Y Nakanuma. Hepatocellular carcinoma arising in non-alcoholic steatohepatitis. Pathol. Int. 2001; 51:127-131.
7. M Shimada, E Hashimoto, M Taniai, et al. Hepatocellular carcinoma in patients with non-alcoholic steatohepatitis. J. Hepatol. 2002; 37:154-160.
8. M Rebuffé-Scrive, R Surwit, M Feinglos, C Kuhn, J Rodin. Regional fat distribution and metabolism in a new mouse model (c57bl/6j) of non-insulin-dependent diabetes mellitus. Metab. Clin. Exp. 1993; 42:1405-1409.
9. P I Parekh, A E Petro, J M Tiller, M N Feinglos, R S Surwit. Reversal of diet-induced obesity and diabetes in c57bl/6j mice. Metab. Clin. Exp. 1998; 47:1089-1096.
10. P Ernsberger, R J Koletsky, J E Friedman. Molecular pathology in the obese spontaneous hypertensive koletsky rat: a model of syndrome x. Ann. N. Y. Acad. Sci. 1999; 892:272-288.
11. N M W de Alwis, C P Day. Non-alcoholic fatty liver disease: the mist gradually clears. J. Hepatol. 2008; 48 Suppl 1:S104-12.
12. W T Dixon. Simple proton spectroscopic imaging. Radiology 1984; 153:189-194.
13. S B Reeder, Z Wen, H Yu, A R Pineda, G E Gold, M Markl, N J Pelc. Multicoil dixon chemical species separation with an iterative least-squares estimation method. Magn Reson Med 2004; 51:35-45.
14. X Zhang, M Tengowski, L Fasulo, S Botts, S A Suddarth, G A Johnson. Measurement of fat/water ratios in rat liver using 3d three-point dixon mri. Magn Reson Med 2004; 51:697-702.
15. H Yu, S B Reeder, A Shimakawa, J H Brittain, N J Pelc. Field map estimation with a region growing scheme for iterative 3-point water-fat decomposition. Magn Reson Med 2005; 54:1032-1039.
16. C D G Hines, H Yu, A Shimakawa, C A McKenzie, T F Warner, J H Brittain, S B Reeder. Quantification of hepatic steatosis with 3-t mr imaging: validation in ob/ob mice. Radiology 2010; 254:119-128.
17. S Narayan, F Huang, D Johnson, M Gargesha, C A Flask, G Zhang, D L Wilson. Fast lipid and water levels by extraction with spatial smoothing (flawless): three-dimensional volume fat/water separation at 7 tesla. J Magn Reson Imaging 2011; 33:1464-1473.
18. S B Reeder, A R Pineda, Z Wen, et al. Iterative decomposition of water and fat with echo asymmetry and least-squares estimation (ideal): application with fast spin-echo imaging. Magn Reson Med 2005; 54:636-644.
19. D H Johnson, S Narayan, C A Flask, D L Wilson. Improved fat-water reconstruction algorithm with graphics hardware acceleration. J Magn Reson Imaging 2010; 31:457-465.
20. D H Johnson, C A Flask, P R Ernsberger, W C K Wong, D L Wilson. Reproducible mri measurement of adipose tissue volumes in genetic and dietary rodent obesity models. J Magn Reson Imaging 2008; 28:915-927.
21. M Bydder, T Yokoo, G Hamilton, et al. Relaxation effects in the quantification of fat using gradient echo imaging. Magn Reson Imaging 2008; 26:347-359.
22. M Morgenstern, J Cline, S Meyer, S Cataldo. Determination of the kinetics of biodiesel production using proton nuclear magnetic resonance spectroscopy (1h nmr). Energy \& fuels 2006; 20:1350-1353.
23. W H Press, S A Teukolsky, W T Vetterling, B P Flanner. Numerical recipies in c: the art of scientific computing, Second edition. New York, NY:Cambridge University Press; 1992. p 402-405.
24. S B Reeder, P M Robson, H Yu, A Shimakawa, C D G Hines, C A McKenzie, J H Brittain. Quantification of hepatic steatosis with mri: the effects of accurate fat spectral modeling. J Magn Reson Imaging 2009; 29:1332-1339.
25. S Meisamy, C D G Hines, G Hamilton, et al. Quantification of hepatic steatosis with t1-independent, t2-corrected mr imaging with spectral modeling of fat: blinded comparison with mr spectroscopy. Radiology 2011; 258:767-775.
26. H H Hu, D L J Smith, K S Nayak, M I Goran, T R Nagy. Identification of brown adipose tissue in mice with fat-water ideal-mri. J Magn Reson Imaging 2010; 31:1195-1202.